There are very few programs in the field of broadcasting in which many look forward to the commercials; yet that is exactly what occurs every year with the broadcast of the Super Bowl. These creative ads are designed to make us laugh, make us cry or make us want the product that’s being marketed. But it’s not just our televisions upon which we intently watch these creative ads-we are searching them out on our other screens (computers, laptops, tablets and phones) to see them again … and again.
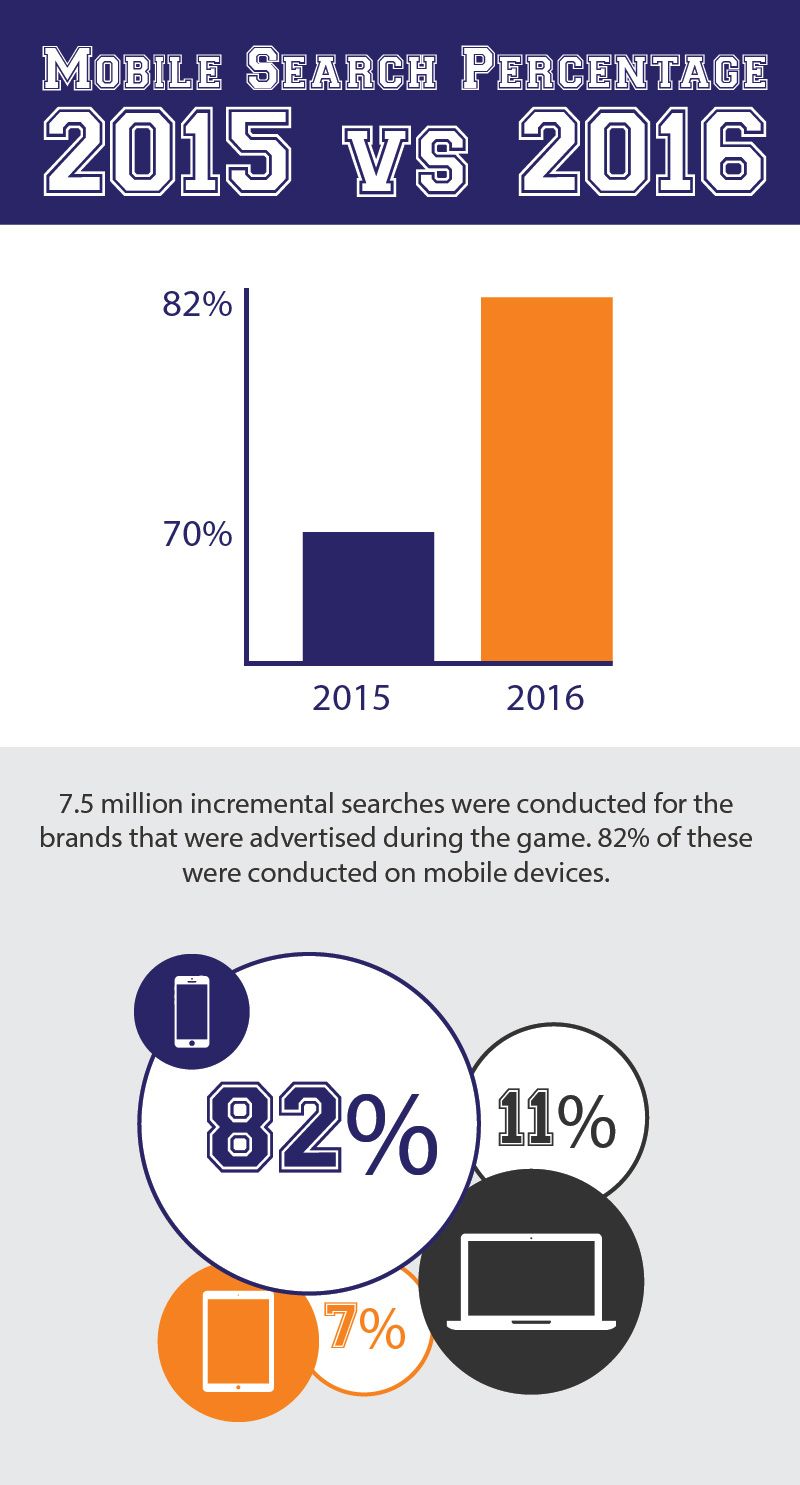
In 2016 there were over 7.5 million incremental searches for the brands that advertised during the game. That’s up by 40% from the searches that were conducted during last year’s game. When compared to a typical television ad, this “second-screen-scramble” is indicative of a 7X response rate, even after taking into consideration the size of the audience.
Second-screen searches are a distinct indication of brand interest, whether they are conducted with the intention of re-watching the ad, learning more about the product or to actually make a purchase. This means that any brand making an appearance on the television screen won’t produce maximum results unless a strategy for the mobile screen is in place.
Thanks to advanced tracking technology, we are able to determine what searches were conducted, and upon which devices. It turns out that during the game, most of the searches actually took place on mobile screens, bumping 2015’s percentage from 70% to a whopping 82%. In comparison, 11% of the searches were conducted on desktops, while 7% were conducted on tablets.
When Payton Manning quarterbacked his way to a victory this year against the Carolina Panthers in the Super Bowl, he saw a whole different ballgame (literally) than when he last played in the National Championship in 2014, in which his Denver Broncos were trounced 43 to 8 by the Seattle Seahawks. His improved scores somewhat mirror the search data from the two games. In this Super Bowl, the first half yielded a strong search volume, while in the second half, as the tension mounted, the search results slowed down as folks paid more attention to the game. On the other hand, during Payton’s 2014 game, the search numbers increased substantially during the second half, as the score was leaning way towards a Seahawks victory and people weren’t paying quite as much attention to the game as they were to the commercials and the products they were touting.
The ads drawing the most searches during the 2016 Super Bowl were:
- Audi - Commander
- Acura - What He Said
- Universal Pictures - Jason Bourne Trailer
- Honda - A New Truck to Love
- Kia - Walken Closet
- 20th Century Fox - Independence Day Trailer
- Amazon - #BaldwinBowl Party
- Doritos - Ultrasound
- Disney - Jungle Book Trailer
- Jeep - 4x4Ever
Micro-moments happen when a consumer turns to his or her device to learn, to do or to buy. Often times, these moments occur in front of the television, when their interests are captured by something that they saw while watching sports, their favorite sitcom or anything else they happen to be viewing when their attention is grabbed. This translates into the necessity for those marketers that are running ads on the big screen, to decide the best ways to engage people on the mobile screens as well. They must be present in the event that the consumer wants to search it out to learn more about the product, watch the ad again or just plain wants to buy the product being advertised.


